HOURLY SALES REPORT
An Hourly Sales Report is a type of sales report that provides a breakdown of sales data by hour of the day. This report is typically used by businesses, particularly in retail or hospitality industries, to track and analyze sales performance on an hourly basis. It helps businesses identify trends, peak sales times, and low-performing hours during the day.
User Access
Who Can Access
- Pothys admin
- Head cashier
- Sales Manager
- manager
What User Can Do
- View Reports
- Analyze Sales
- Export
Pre-Requisite Activities
- Date range
- Cashier
Business Rules
- Data is segmented by each operational hour from store opening to closing time.
- Sales Revenue includes the total value of sales within the hour, accounting for any discounts, returns, or promotions.
- Number of Transactions is the total count of completed sales within the hour.
- Sold Quantity refers to the number of products sold in each hour.Sales growth and comparisons are calculated based on percentage change from previous hours or days.
- Data accuracy must be ensured by correctly timestamping every transaction.
- Peak and off-peak hours should be highlighted for further operational analysis.
- The report must be generated daily, ideally at the close of business, to provide accurate and timely insights into sales performance.
- Staffing levels should be optimized based on sales performance by hour, and any recommendations should be included for operational efficiency.
User Interface
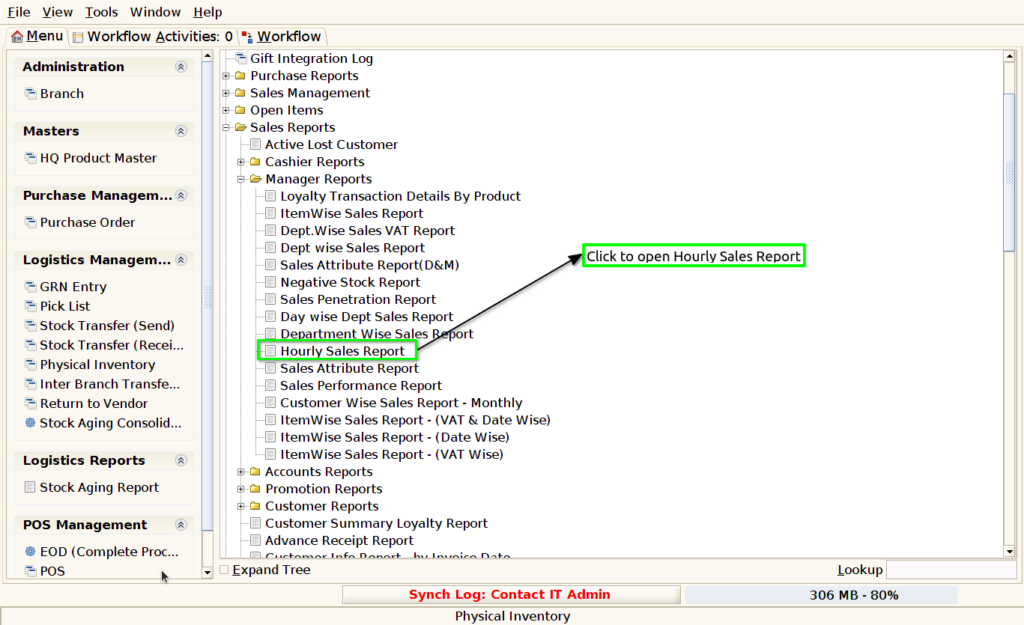
Step 1 : Select ‘ Hourly Sales Report’ in Menu -> Sales reports > Manager report > Hourly Sales Report or Search Hourly Sales Report .

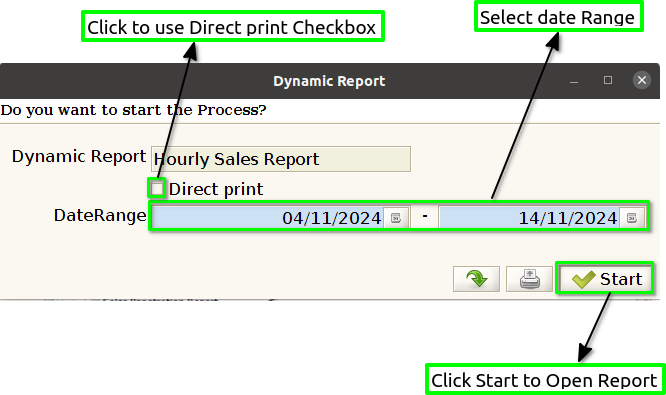
Step 2 : Select the date to open the Hourly Sales Report.

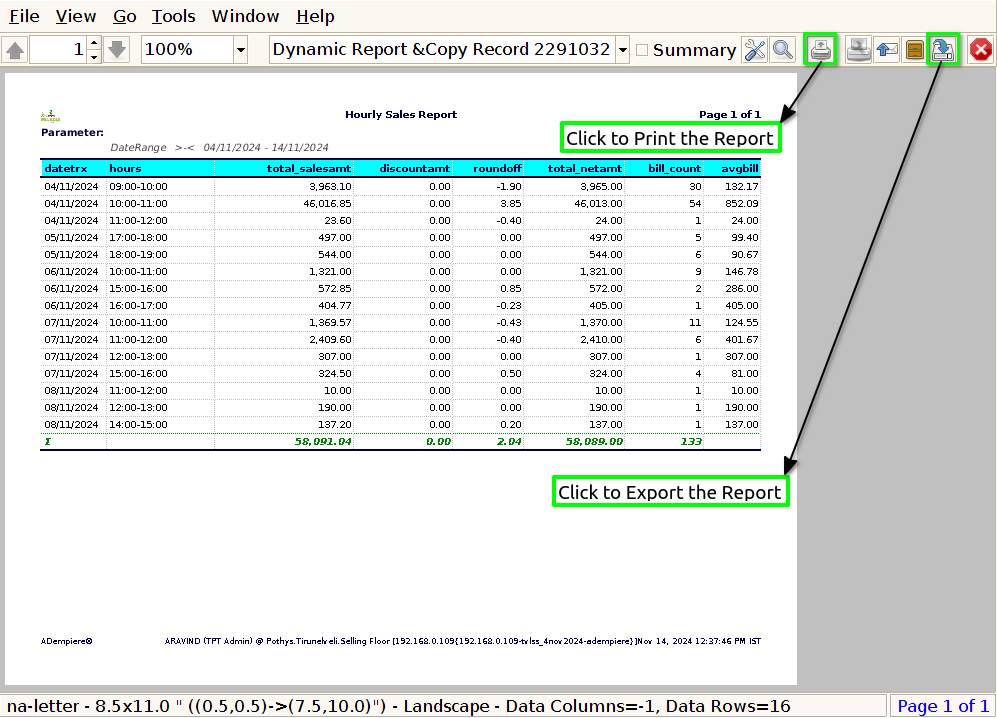
Step 3 : To view a preview of the Hourly Sales Report in Jaldi.

Date : By adding a date column in the Hourly Sales Report, you ensure that the data is organized and can be accurately referenced for any particular day. Whether it’s for a single day or multiple days, having the date visible at the top or in each row helps provide clarity and context to the sales data.
Hours : The Hour column helps identify peak hours during the day when sales are highest. For example, in the above report, sales are strongest between 6:00 PM – 7:00 PM and 7:00 PM – 8:00 PM, which are likely prime shopping or dining hours.
Total sales Amount : To show the Total Sales Amount in an Hourly Sales Report, you would typically calculate the sum of Sales Revenue for each hour. This value represents the total sales revenue generated during each hourly interval. Additionally, you might want to show a Grand Total of all hourly sales at the end of the report to capture the overall sales for the day.
Discount Amount : To show the Discount Amount in an Hourly Sales Report, you can include a dedicated column that tracks the total amount of discounts given during each hour. This will help you understand how discounts impact sales during different times of the day.
Round Off : To show the Round-Off amount in an Hourly Sales Report, you’ll want to capture the difference between the actual sales revenue (before rounding) and the rounded value that appears in your system or on the customer receipt.
Total Net Amount : To show the Total Net Amount in the Hourly Sales Report, you would need to include a column that reflects the actual sales revenue after accounting for discounts, returns, and any applicable taxes.
Bill Count : Bill Count shows the number of transactions or bills processed during the hour. It reflects how many separate sales were made, regardless of the total value of the transactions.
Average bill : To show the Average Bill in the Hourly Sales Report, you would need to calculate the average value of each individual bill (transaction) during the specified hour.